How many CPAs are in the US? The CPA population, and the people coming next.
NASBA reports 650,667 actively licensed CPAs across 53 of 55 U.S. licensing jurisdictions. Explore how that reported population has changed, how many people are taking the CPA Exam, and what the available state-by-state data shows.
53 of 55 jurisdictions
Includes new and returning candidates
First-time entrants to the exam
650,667 is the latest published covered count.
The latest NASBA population snapshot excludes Hawaii and New Mexico. It counts actively licensed CPAs in the reporting jurisdictions, rather than everyone who has ever passed the exam or worked in accounting. Read the count alongside its coverage when comparing the size of the profession over time.
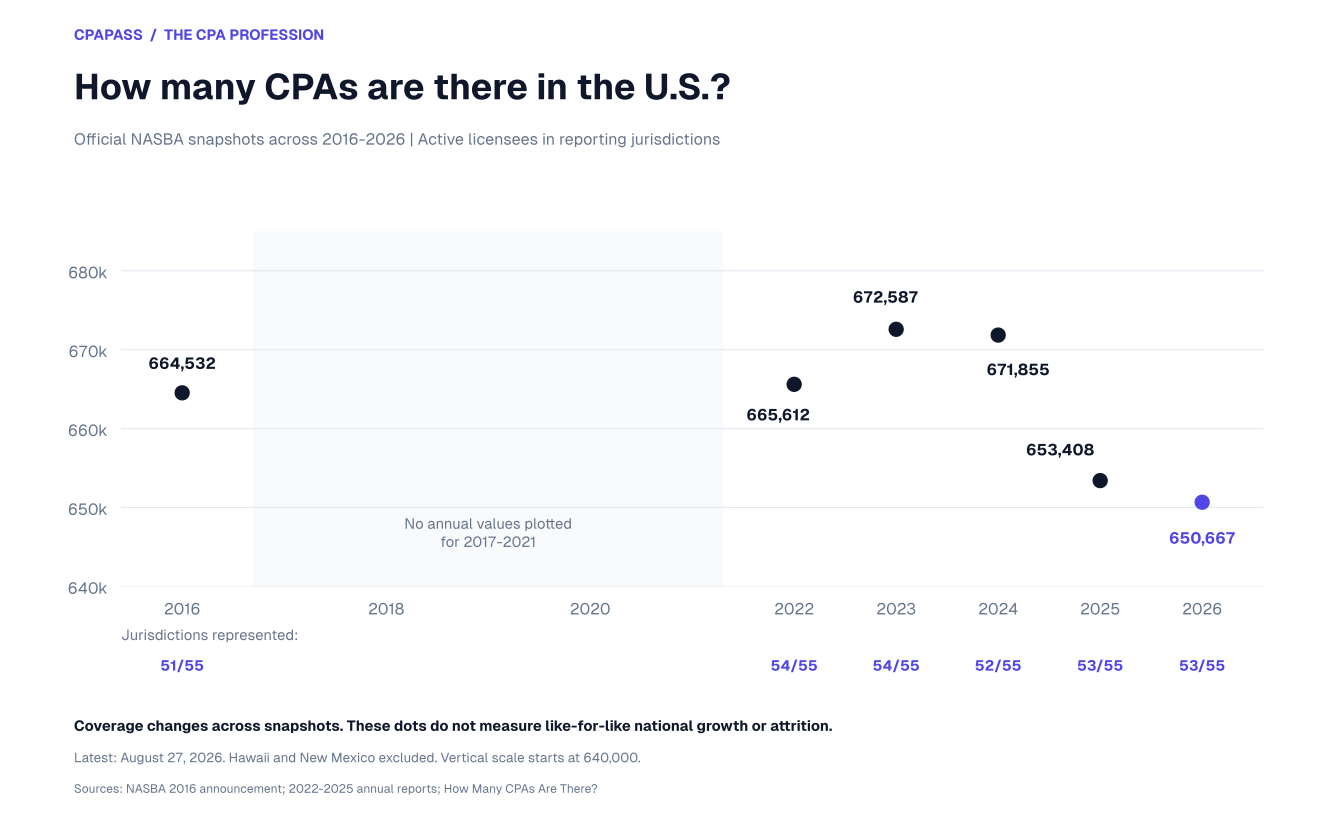
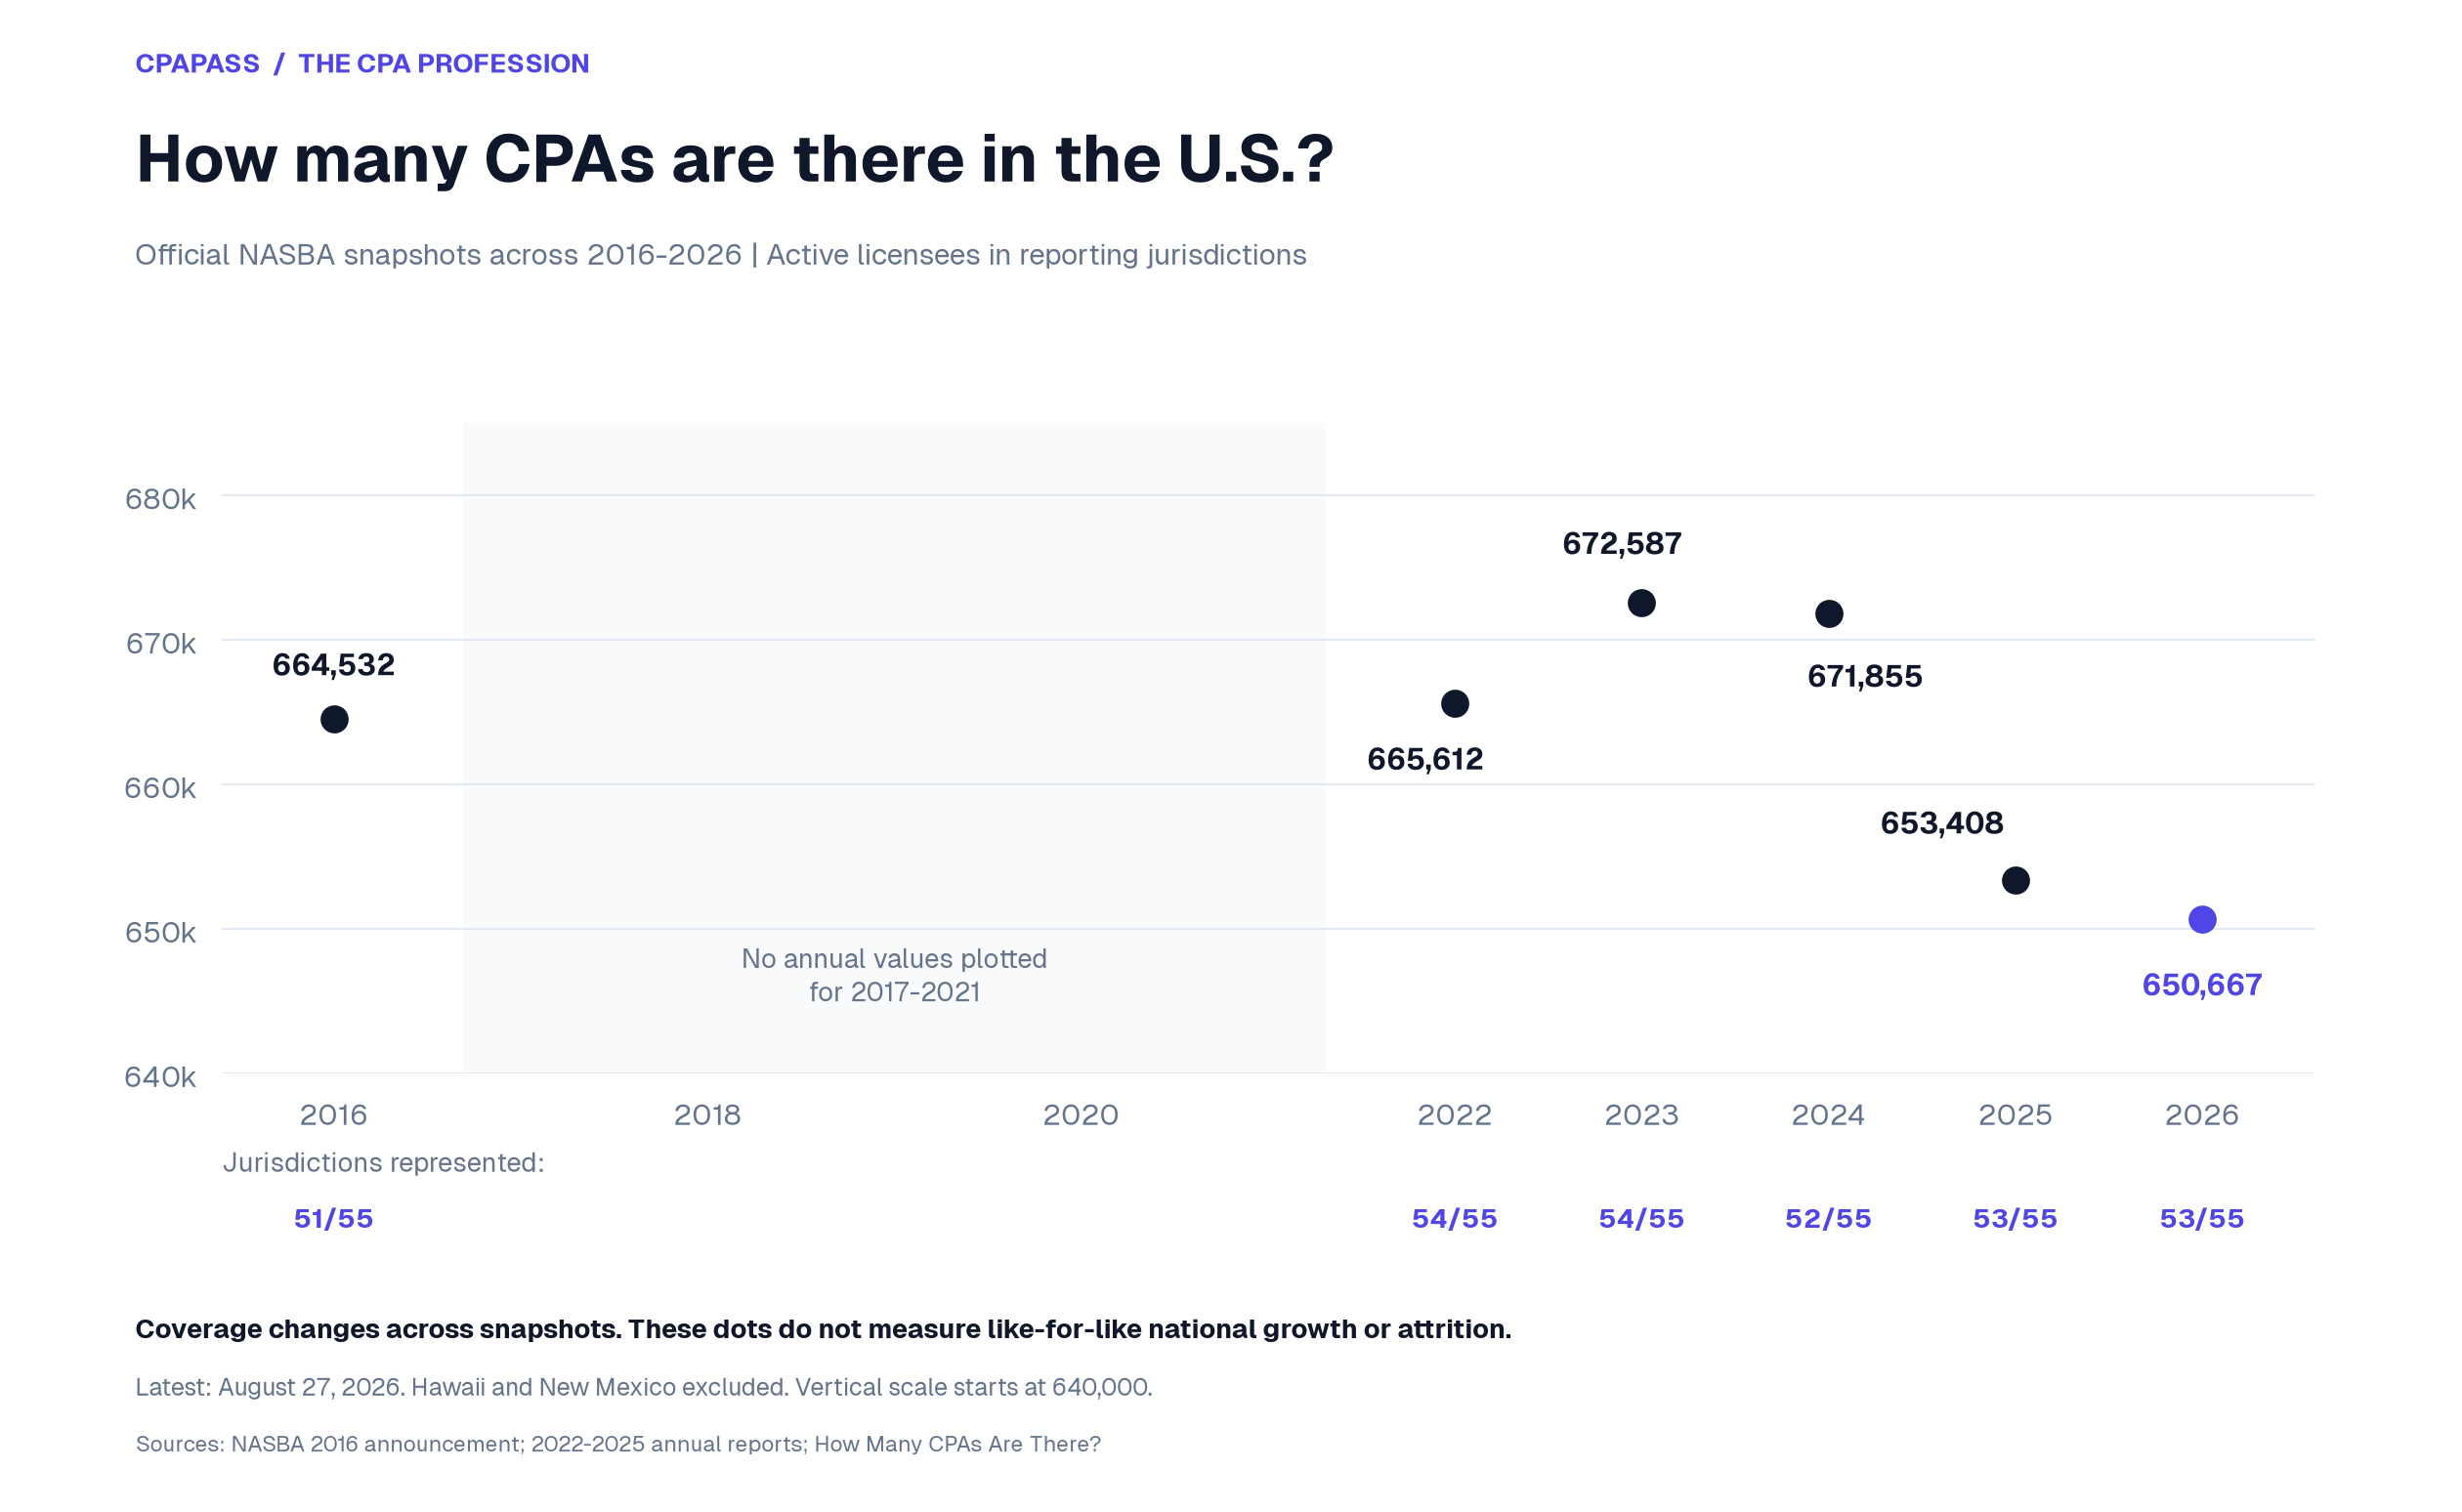
Coverage changes across these snapshots. Changes in participating boards, record matching and license-status treatment can affect totals. These observations do not establish a consistent national growth rate or retirement trend. The chart leaves missing years unfilled rather than estimating annual counts.
The latest figure is 2,741 below the 2025 figure of 653,408, a 0.42% decrease in the reported count (our calculation). Both cover 53 jurisdictions and exclude Hawaii and New Mexico. That difference alone cannot identify retirements, departures or the cause of the change.
The population statistic describes license holders. For the distinction between the credential, the exam and an accounting job, see what a CPA is. Employment outlook and pay are separate measures covered in the CPA salary and career guide.
Exact population data and dates
| Snapshot | Active CPAs | Coverage | Source |
|---|---|---|---|
| 2016-04-22 | 664,532 | 51/55 | NASBA 2016 population announcement |
| 2022-08 | 665,612 | 54/55 | NASBA 2022 Annual Report |
| 2023-08 | 672,587 | 54/55 | NASBA 2023 Annual Report |
| 2024-08 | 671,855 | 52/55 | NASBA 2024 Annual Report |
| 2025-08 | 653,408 | 53/55 | NASBA 2025 Annual Report |
| 2026-08-27 | 650,667 | 53/55 | NASBA: How Many CPAs Are There? |
Month-only dates reflect the precision in the annual reports. The 2016 announcement describes matching most multi-state records to avoid duplicate people. State-license counts should not be summed to reconstruct this national statistic.
CPA Exam pass rates, section by section.
AICPA publishes pass rates for each exam section. The comparison below places a completed calendar year beside cumulative results through the second quarter. In the latest partial-year results, FAR has a 42.95% pass rate and TCP has a 79.53% pass rate. These percentages describe different candidate groups and different exam content.
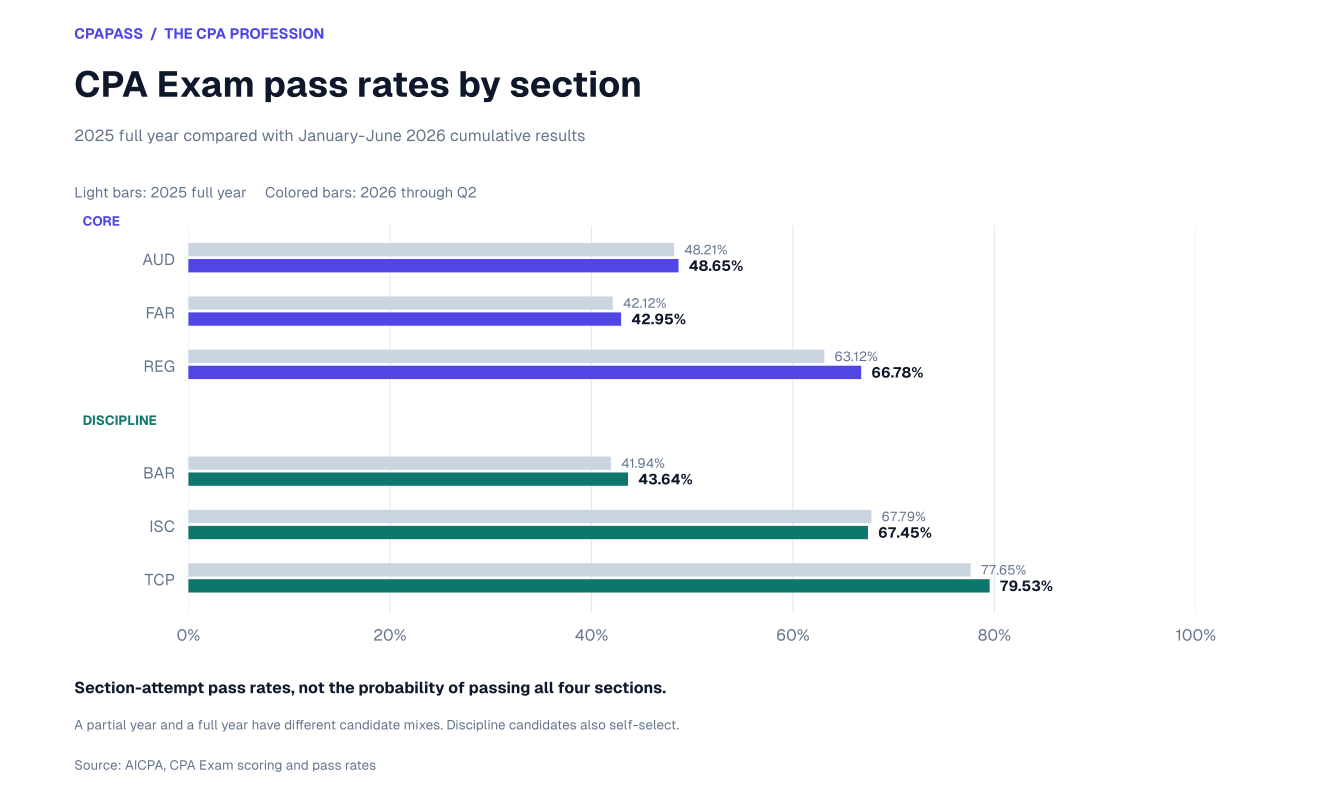
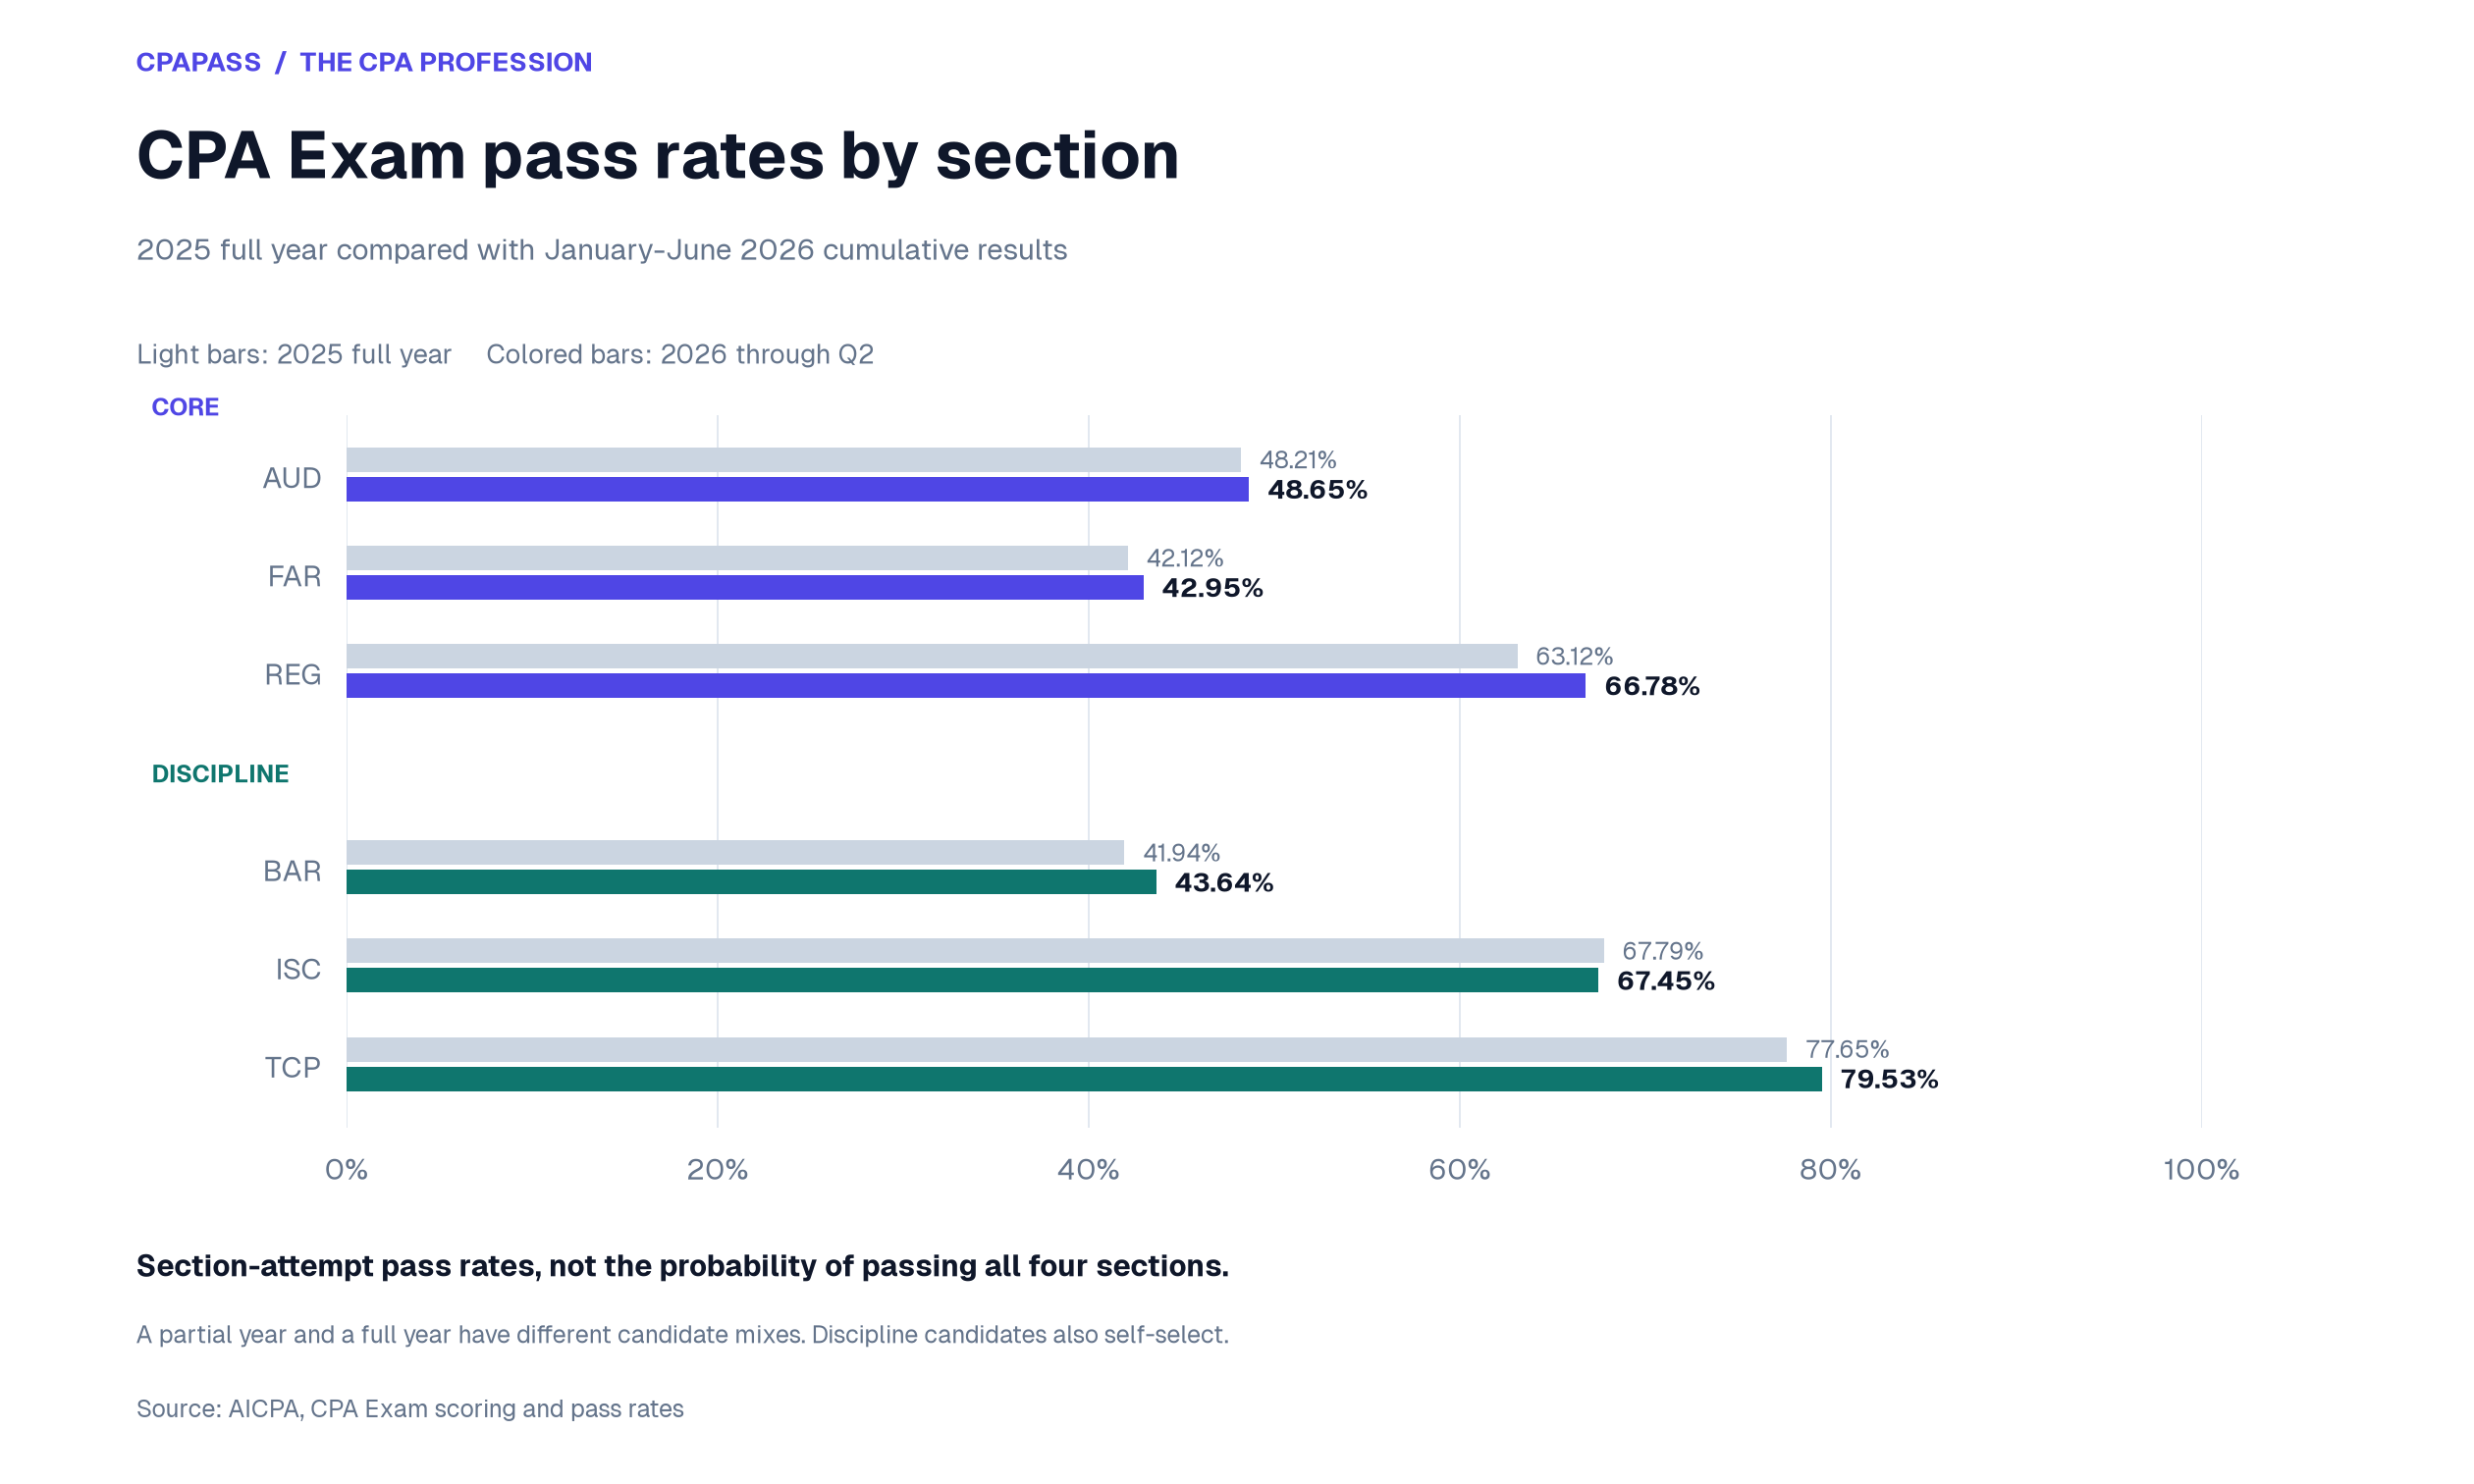
Each figure is a section-attempt pass rate, not the probability of passing all four sections. Averaging the six percentages does not produce an overall exam pass rate, and multiplying them does not produce an all-four passing probability. Candidates select their discipline, and the published totals are not first-attempt success rates.
A partial year and a full year also have different candidate mixes. Use these results as context when planning your preparation, rather than as a prediction of your own outcome. A score of 75 is the passing scaled score, not 75% correct. The CPA Exam pass-rate guide explains the section comparisons in more detail.
Exact pass-rate table
| Section | 2025 full year | 2026 through Q2 |
|---|---|---|
| AUD | 48.21% | 48.65% |
| FAR | 42.12% | 42.95% |
| REG | 63.12% | 66.78% |
| BAR | 41.94% | 43.64% |
| ISC | 67.79% | 67.45% |
| TCP | 77.65% | 79.53% |
Source: AICPA CPA Exam scoring and pass rates. The 2026 column is cumulative through Q2, not a completed year.
Exam participation adds the 10-year view.
In 2025, 87,660 candidates took at least one CPA Exam section, including 36,590 new candidates. The historical series begins with 102,291 total candidates and 48,004 new candidates in 2016. Participation fell over much of the intervening period, with a rise ahead of CPA Evolution and another increase in the latest full year.
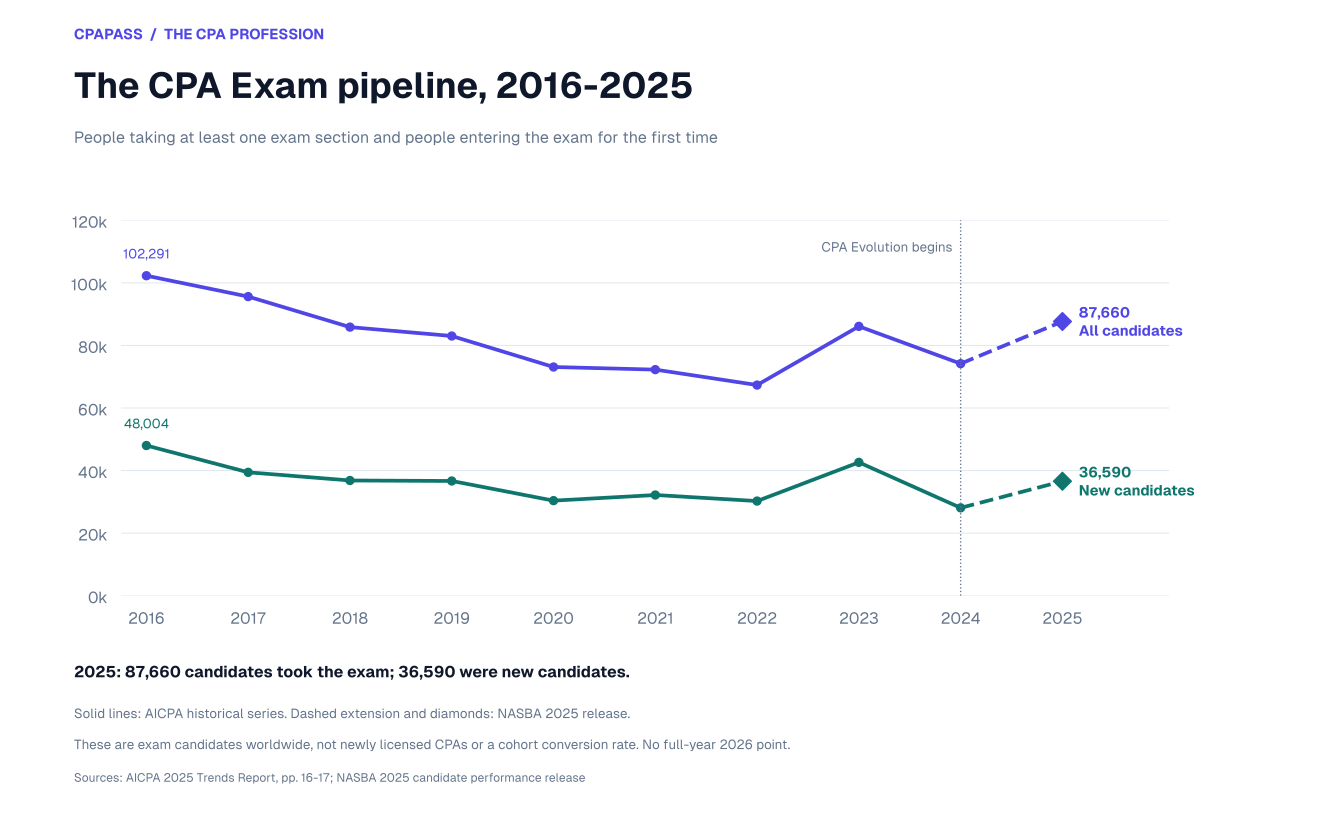
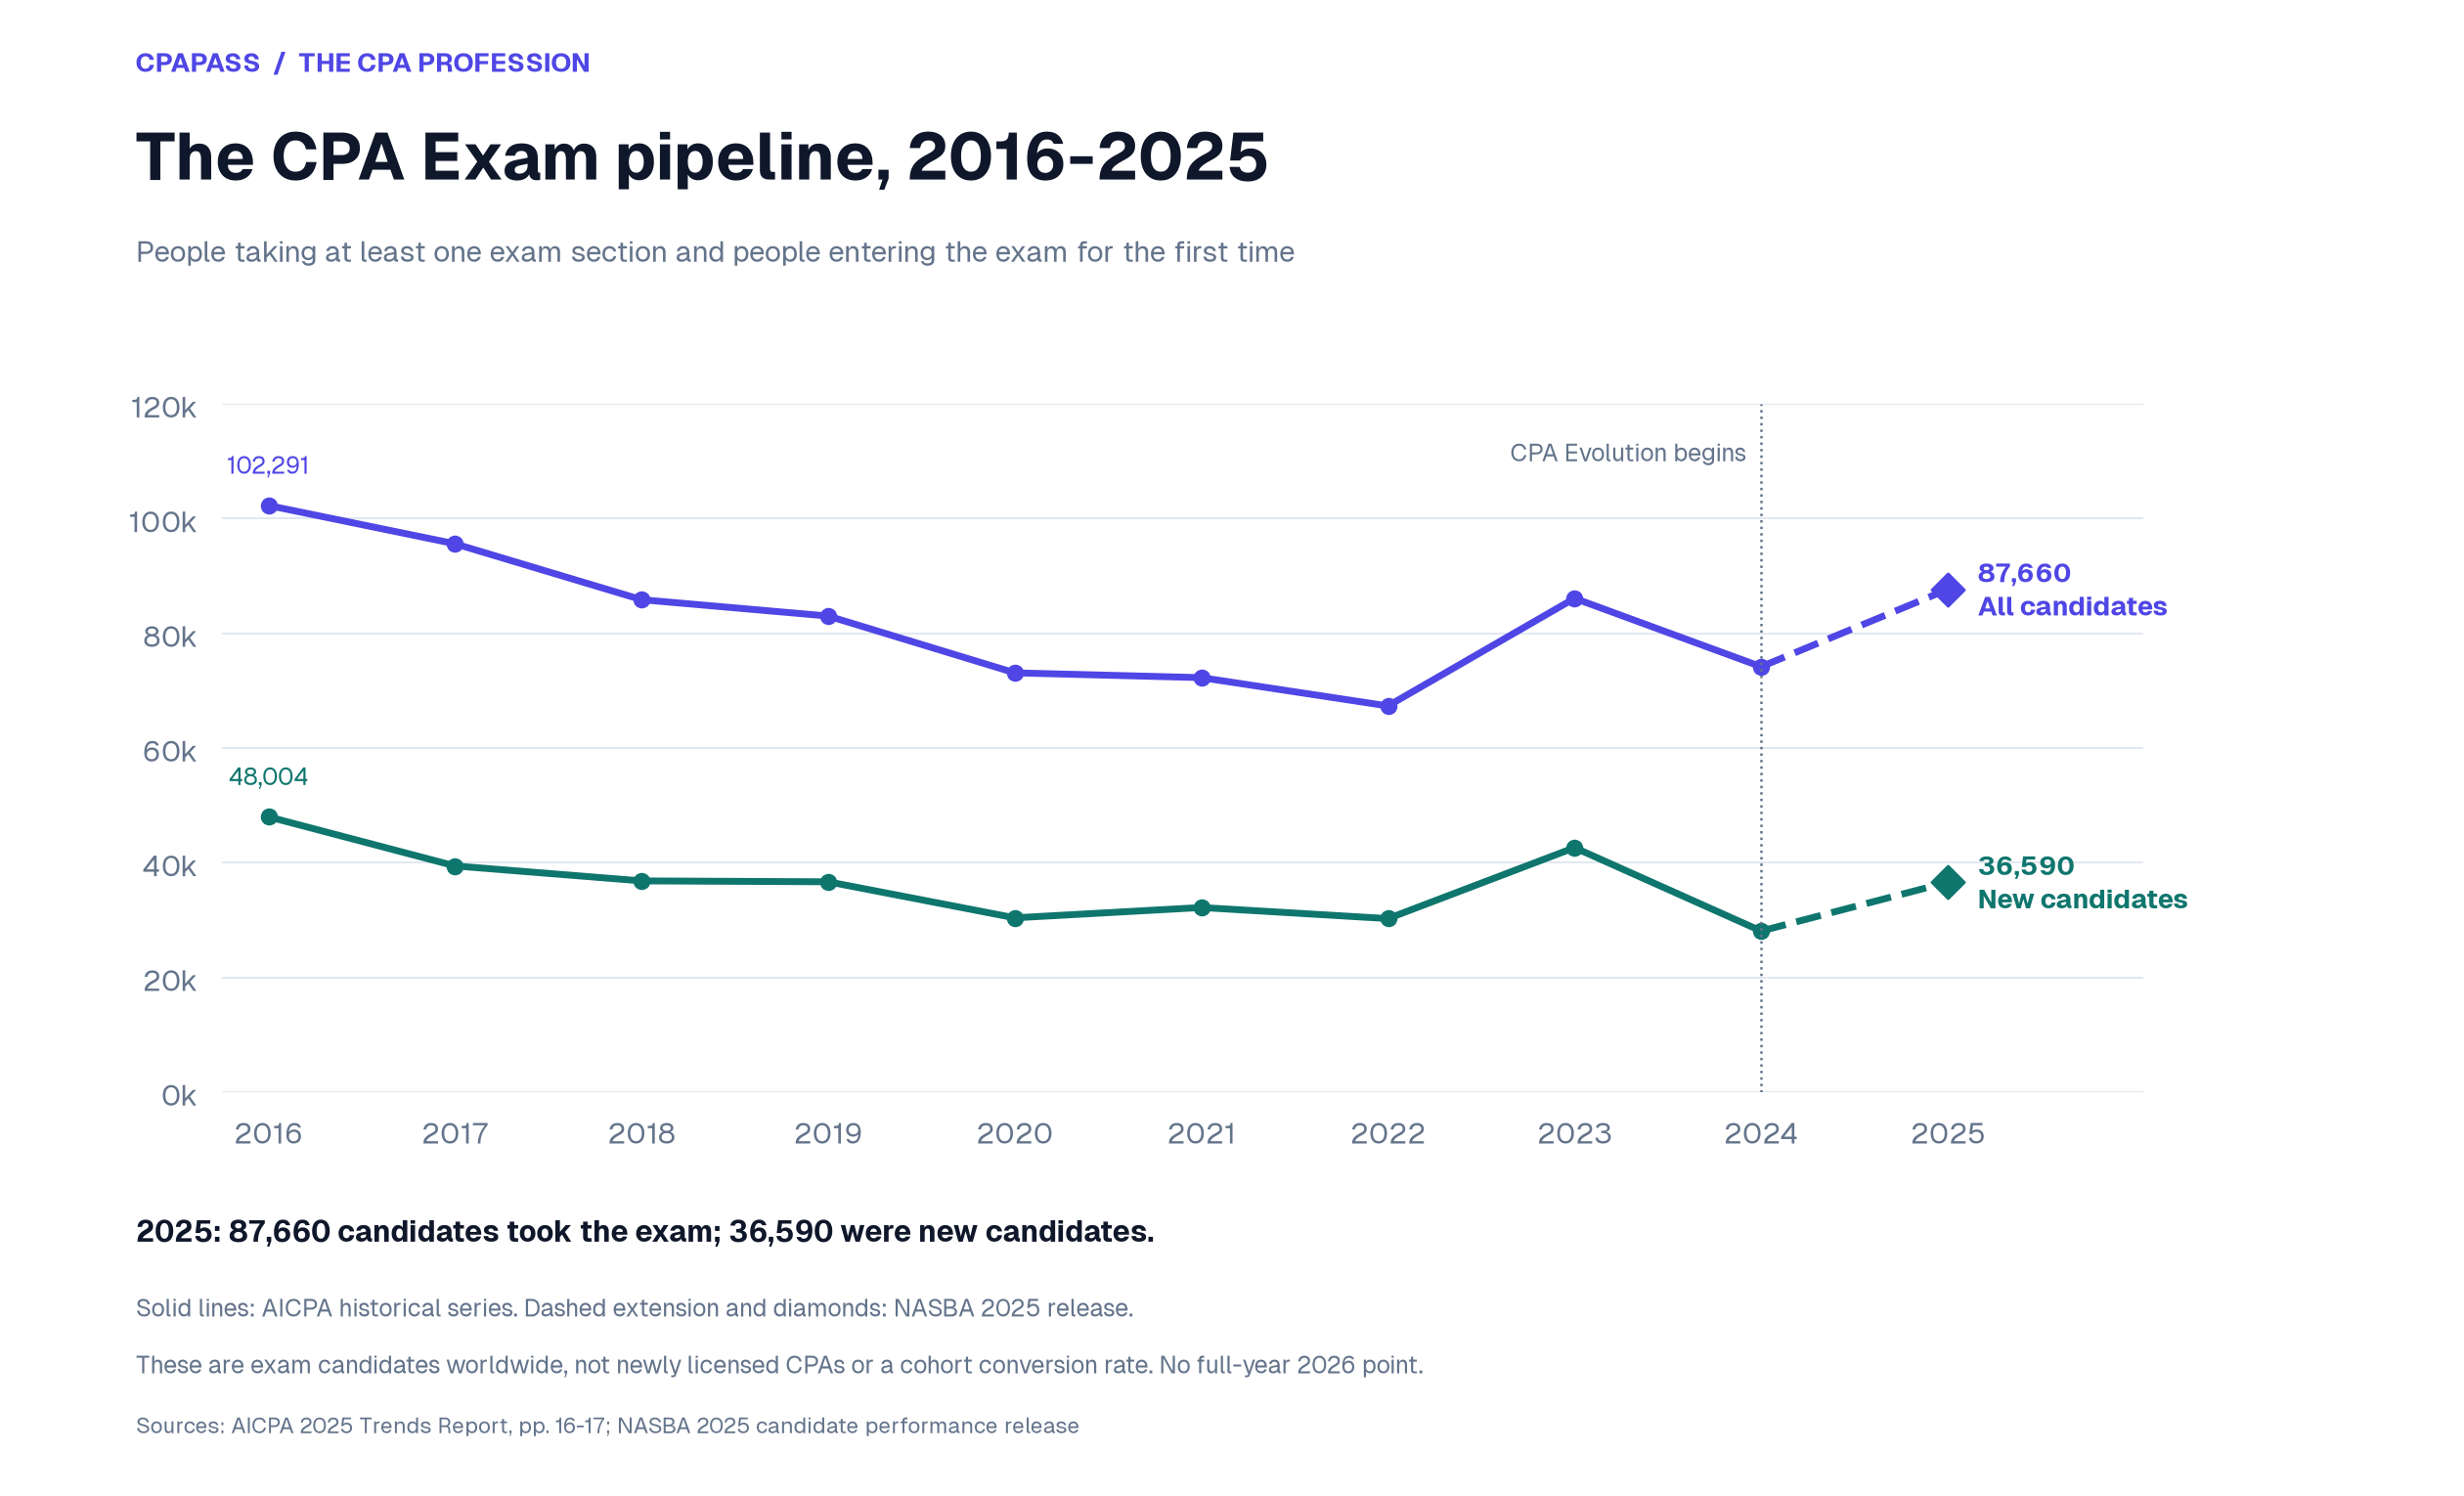
These are people taking the U.S. CPA Exam, including international candidates. They are not newly licensed CPAs. The new-candidate line counts first-time entrants to the exam; it is a subset of total candidates, so the two lines should not be added together. Neither line tracks one cohort all the way from enrollment to licensure.
The 2024-2025 completion jump needs a reporting note. AICPA explains that NASBA moved from test attendance dates to score-receipt dates, moving many late-2024 completions into 2025. The increase from 13,070 to 23,978 final-section completions cannot be read as a clean increase in new CPAs.
Passing the final exam section and receiving a license are separate steps. Education, experience and other board requirements still matter. Follow the CPA licensing guide for the board-first sequence, and use the CPA Exam Blueprints to understand what the exam tests.
Annual pipeline data and source reconciliation
| Year | All candidates | New candidates | Final section passed |
|---|---|---|---|
| 2016 | 102,291 | 48,004 | 27,889 |
| 2017 | 95,612 | 39,436 | 25,514 |
| 2018 | 85,859 | 36,827 | 23,941 |
| 2019 | 83,013 | 36,670 | 23,365 |
| 2020 | 73,106 | 30,385 | 20,703 |
| 2021 | 72,271 | 32,186 | 19,544 |
| 2022 | 67,336 | 30,251 | 18,847 |
| 2023 | 86,103 | 42,626 | 19,382 |
| 2024 | 74,175 | 28,082 | 13,070 |
| 2025 | 87,660 | 36,590 | 23,978 |
2016-2024: AICPA 2025 Trends Report, pages 16-18. 2025: NASBA 2025 exam performance release. The chart uses AICPA’s historical series consistently through 2024. NASBA 2024 exam performance release gives 74,165 total and 27,994 new candidates; AICPA gives 74,175 and 28,082. Using NASBA’s own releases for both years gives +18.2% total candidates and +30.7% new candidates from 2024 to 2025.
A state-by-state breakdown, with its data year.
NASBA’s State Board Profiles provide historical active-license counts for 46 states, the District of Columbia and four territories. California, Illinois, Kansas and Minnesota use 2019 values; the other reported values use 2020. Delaware, Hawaii, Pennsylvania and Vermont are blank in the source. The table labels those entries Unavailable.
These counts belong to the issuing jurisdiction and do not necessarily count state residents. One person can hold licenses in multiple states, so adding the rows would not produce a deduplicated national CPA population. Missing values are not zero. This historical table should not be presented as a current 50-state census.
Search by state name or abbreviation, or sort by the largest reported count. California has the largest count in this source, followed by Texas and New York. Their rows describe the source period, not a current ranking. Check the relevant state board when you need a newer count or a particular definition of active registration.
| State / jurisdiction | Active licensees | Data year |
|---|---|---|
| Alabama (AL) | 7,111 | 2020 |
| Alaska (AK) | 1,372 | 2020 |
| Arizona (AZ) | 10,111 | 2020 |
| Arkansas (AR) | 3,700 | 2020 |
| California (CA) | 74,619 | 2019 |
| Colorado (CO) | 16,212 | 2020 |
| Connecticut (CT) | 7,561 | 2020 |
| Delaware (DE) | Unavailable | Unavailable |
| District of Columbia (DC) | 3,440 | 2020 |
| Florida (FL) | 33,092 | 2020 |
| Georgia (GA) | 21,088 | 2020 |
| Guam (GU) | 4,217 | 2020 |
| Hawaii (HI) | Unavailable | Unavailable |
| Idaho (ID) | 2,840 | 2020 |
| Illinois (IL) | 23,372 | 2019 |
| Indiana (IN) | 10,537 | 2020 |
| Iowa (IA) | 5,139 | 2020 |
| Kansas (KS) | 3,979 | 2019 |
| Kentucky (KY) | 8,560 | 2020 |
| Louisiana (LA) | 7,778 | 2020 |
| Maine (ME) | 2,102 | 2020 |
| Maryland (MD) | 15,454 | 2020 |
| Massachusetts (MA) | 19,737 | 2020 |
| Michigan (MI) | 13,374 | 2020 |
| Minnesota (MN) | 10,344 | 2019 |
| Mississippi (MS) | 3,832 | 2020 |
| Missouri (MO) | 12,164 | 2020 |
| Montana (MT) | 2,262 | 2020 |
| Nebraska (NE) | 2,715 | 2020 |
| Nevada (NV) | 3,434 | 2020 |
| New Hampshire (NH) | 6,076 | 2020 |
| New Jersey (NJ) | 20,847 | 2020 |
| New Mexico (NM) | 2,827 | 2020 |
| New York (NY) | 60,045 | 2020 |
| North Carolina (NC) | 22,243 | 2020 |
| North Dakota (ND) | 2,982 | 2020 |
| Northern Mariana Islands (CNMI) | 9 | 2020 |
| Ohio (OH) | 31,836 | 2020 |
| Oklahoma (OK) | 10,278 | 2020 |
| Oregon (OR) | 7,222 | 2020 |
| Pennsylvania (PA) | Unavailable | Unavailable |
| Puerto Rico (PR) | 3,136 | 2020 |
| Rhode Island (RI) | 1,888 | 2020 |
| South Carolina (SC) | 6,143 | 2020 |
| South Dakota (SD) | 1,260 | 2020 |
| Tennessee (TN) | 11,284 | 2020 |
| Texas (TX) | 60,488 | 2020 |
| U.S. Virgin Islands (VI) | 66 | 2020 |
| Utah (UT) | 5,722 | 2020 |
| Vermont (VT) | Unavailable | Unavailable |
| Virginia (VA) | 29,200 | 2020 |
| Washington (WA) | 21,052 | 2020 |
| West Virginia (WV) | 2,218 | 2020 |
| Wisconsin (WI) | 12,874 | 2020 |
| Wyoming (WY) | 778 | 2020 |
Source: NASBA 2020 State Board Profiles, pages 31-33.
A current state example: New York
NYSED reports 68,541 registered CPA licensees in its 2026 geographic distribution. Of those, 44,766 have New York mailing addresses, 22,791 have other U.S. addresses and 984 have non-U.S. addresses. The total therefore answers a different question from how many registered CPAs have a New York mailing address.
Registered does not necessarily mean actively practicing. A state comparison needs a common period and definition: licenses issued by a jurisdiction, mailing addresses within a state, or people practicing there. This current New York example remains separate from the historical table to keep those distinctions visible.
What percentage of accountants are CPAs?
No reviewed official source publishes the requested exact percentage. A license-holder count and an occupational jobs count do not describe the same population. They differ in units, coverage, definitions and reference period. Dividing one by the other gives a cross-dataset calculation, not an official share of accountants who are CPAs.
The sometimes-quoted 41.4% must not be used as the headline percentage of accountants who are CPAs. An active CPA may work outside a narrowly defined accounting occupation, and an accountant or auditor may not hold a CPA license. A defensible percentage would require both counts from the same defined population.
If you are considering joining the profession, try five free CPA practice questions to see the format and explanations, or request the existing six-section practice PDF bundle. Neither practice activity nor exam participation changes the definition of the national license count.
Source register
- NASBA 2016 population announcementPDF page 1
- NASBA 2022 Annual ReportPrinted page 29, August 2022
- NASBA 2023 Annual ReportPrinted page 27, August 2023
- NASBA 2024 Annual ReportPDF page 34 / printed page 33
- NASBA 2025 Annual ReportPDF page 34 / printed page 33; coverage on printed page 28
- NASBA: How Many CPAs Are There?August 27, 2026 snapshot
- AICPA CPA Exam scoring and pass ratesUpdated July 15, 2026; 2025 and Q1-Q2 2026 cumulative tables
- AICPA 2025 Trends ReportPages 16-18, exhibits 3.1-3.3
- NASBA 2024 exam performance release2024 calendar year
- NASBA 2025 exam performance releaseAnnouncement dated August 18, 2026; 2025 calendar year
- NASBA 2020 State Board ProfilesPDF pages 31-33; profile dated May 27, 2020
- NYSED CPA license statisticsGeographic distribution as of July 1, 2026
CPA population questions
How many CPAs are there in the US?
NASBA reports 650,667 actively licensed CPAs. The latest published count covers 53 of 55 U.S. licensing jurisdictions and excludes Hawaii and New Mexico.
Is the number of CPAs declining?
The latest reported count is 2,741 below the 2025 snapshot. Coverage varies over the longer series, and the difference alone cannot identify retirements, departures or a like-for-like national trend.
How many CPAs does each state have?
The historical table on this page reports active licensees for 46 states, D.C. and four territories from NASBA’s State Board Profiles. Four states have no reported value. The rows use 2019 or 2020 data and should not be treated as current counts or added into a national total.
What is the CPA Exam pass rate?
AICPA reports pass rates by section. Cumulative results through Q2 2026 are AUD 48.65%, FAR 42.95%, REG 66.78%, BAR 43.64%, ISC 67.45% and TCP 79.53%. These are section-attempt rates, not the probability of passing all four sections.
What percentage of accountants are CPAs?
No reviewed official source publishes an exact percentage. Dividing a CPA license count by accountant-and-auditor jobs mixes different populations, definitions and periods, so it does not establish an official share.